Google Analytics is one of the most used analytics tools for website traffic reports and all digital marketing companies use this tool. If you plan to go for a digital marketing interview or Google Analytics Interview and you wonder what Google Analytics interview questions are usually asked – this article is for you! We have prepared the list of the top 30 Google Analytics interview questions and answers which will help you to be the best preparation for the interview.
Check also our free guide How to prepare for a first job interview.
Let’s begin!

Table of Contents
Google Analytics Interview Questions & Answers
What is Google Analytics?
This is for sure one of the most popular and basic Google Analytics interview questions. You really need to master this answer.
Google Analytics is a tool offered by Google which helps to analyze the performance of your website or your web application. Thanks to Google Analytics you can generate various reports, such as visitors per day or device types used by the users while accessing your website or web application. What is more, Google Analytics helps to understand better your users/customers. For that, you can use geolocation or the reports showing, for example, through which channel the users are coming to your website.
It is also worth mentioning that most features are free but you can also buy a paid version, Google Analytics 360, which will provide you much more features, such as custom funnel reports, custom tables, faster data refresh, etc.
Who created Google Analytics?
The very first version of Google Analytics, known as Urchin, was written in the late ’90s by Paul Muret, Jack Ancone, Brett Crosby, and Scott Crosby, owners of Urchin Software Corporation. In 2005, it got acquired by Google, rebranded officially Google Analytics, and released soon afterward.
How does Google Analytics work?
This is a very vague question and should be answered, depending on the position which you apply for, in a more or less technical way.
Google Analytics provides you a tracking code or a piece of JavaScript code that is needed to be added to the website. Once it is done, every time a user visits the website, JavaScript code refers to a JavaScript file that starts tracking the user’s behavior and operations.
For more, read Tracking Code Overview.
Is Google Analytics free?
This is not only one of the most popular Google Analytics interview questions but in general one of the most popular Google Analytics search queries. The answer is yes, but it is not as easy as it seems.
Google Analytics is free up to some extent. Below you can find the list of the free version limitations:
- Data Volume Capacity: up to 10 Million Hits per month
- Data Freshness: 24+ hours
- Max Data Rows: 50,000 rows
- Custom Dimensions & Metrics: 20 of each
Free tools:
- Real-Time Data
- Social Reporting
- Custom Reporting
- Conversion Reporting
- Multi-Channel Reporting
- Advanced Segmentation
- Flow Visualization
- Mobile Device & App Tracking
- Video Performance Measurement
- Integration with AdWords, AdSense, Search Console, and DoubleClick AdExchange
- Data Export & Tracking API
What Google Analytics cannot do?
These are the operations that you cannot perform through Google Analytics:
- Google Analytics does not allow tracking individual users. Google has a strict policy not to store any Personally Identifiable Information (PII), such as user name, IP address, etc. For more information, check section 7 of Google Analytics terms and conditions.
- Google Analytics can only process data when the tracking code is added to a website. You can import the old data from some other tool (using data import functionality) but the historical data will not be visible. For example, if you add tracking on January, 1st 2023, you will be able to see the data starting from this day only.
- Google Analytics uses cookies to differentiate between new and old users. If a user deletes the cookies and visits your website again, he will be considered a new user.
- It is impossible to track if a user visits some of your competitors’ websites or if he exits your website, which website he goes to after that.
- Google Analytics cannot track the social sites or pages related to your website.
What are KPIs in Google Analytics?
KPI stands for Key Performance Indicators. They are used to monitor user’s behavior on websites. Below you can find some KPI examples which are useful for any website:
- Sessions and Users.
- New vs returning visitors.
- Bounce rate.
- Average time on the pages.
- Organic vs paid visitors.
- Users by age.
- Users by gender.
- Pages per session.
- Top pages.
- Top search queries.
What is a session in Google Analytics?
A session is a group of interactions done by a user in a specific amount of time. Let us share with you the following example: whenever a user visits your website, views the pages, do a purchase, searches something, or performs any other operation and leaves – all these actions are considered as one session. The default time frame for Google Analytics is set to 30 minutes.
To read more about the sessions, click here.
What is real-time data?
Real-time data refers to the data which is being collected on the spot, in the real world, and processed to create meaningful insights. When the real-time data is gathered and used? For example, when a person visits your website or application, each hit is displayed in your analytics tools in microseconds. Another example is when someone completes a purchase and you can check in real-time what has been sold and if any other user has this item in a cart and it will be abandoned.
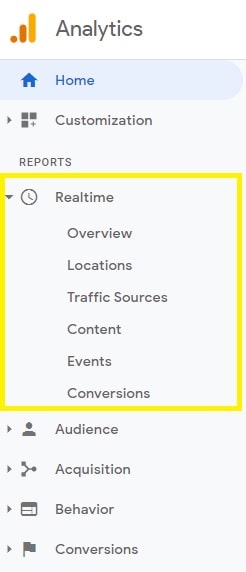
Does Google Analytics support real-time data?
Yes, real-time functionality is available in GA. To access it, login to your Google Analytics account and navigate to the “Reports” tab as shown below:
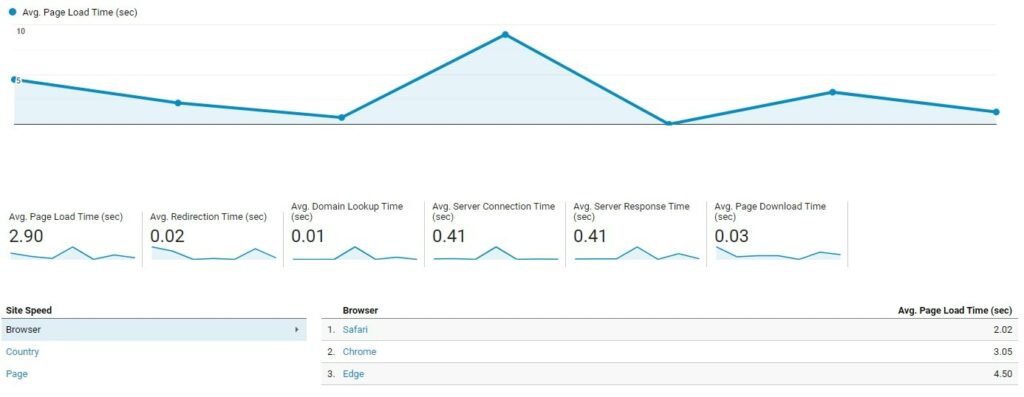
Can we measure page speed in Google Analytics?
Yes, we can measure page speed through Google Analytics and we can check it by simply navigating to the “Reports” and select “behavior”. In the subsection, you will find the Site Speed.
What are traffic channels?
In short, a traffic channel is a source through which a visitor comes to your website. Google Analytics measures your website traffic automatically and categorizes it into default channel categories. This report is more than helpful as from a digital marketing perspective, it is extremely important to know how people find your website.
Below you can find the list of 10 default Google Analytics channel categories:
- Direct
- Organic Search
- Social
- Affiliates
- Referral
- Paid Search
- Other Advertising
- Display
- Other
SEM interview questions and answers 2022
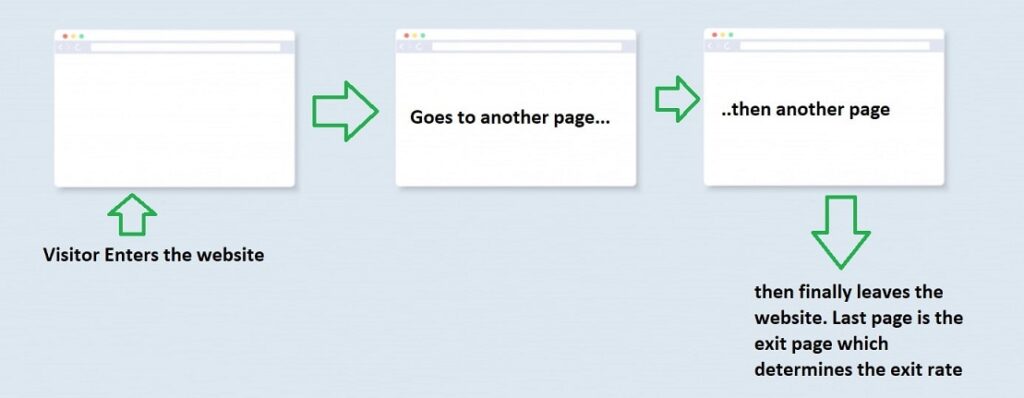
What is the exit rate in Google Analytics?
Exit rate is a metric defining the number of visitors who have left your website after visiting one single page. It can be calculated as the number of exits divided by the number of page views of the particular page.
Let us explain it in the following example. There is a user who searches for a product on Google, visits some e-commerce website homepage, goes to a category page, next, on a product page, and then decides to leave. In this case, the exit rate will be calculated on the product page.
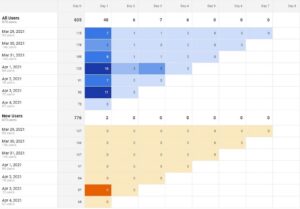
What are user retention and cohort analysis?
User retention is a widget provided out of the box by Google Analytics and it can be used to analyze user engagement and disengagement. It is a reliable KPI to measure product and customer engagement.
A cohort is a group of users that shares common characteristics. You can analyze different cohorts over time. It is one of the simplest ways to measure your audience and pages.
For more, click here.
What are demographics in Google Analytics?
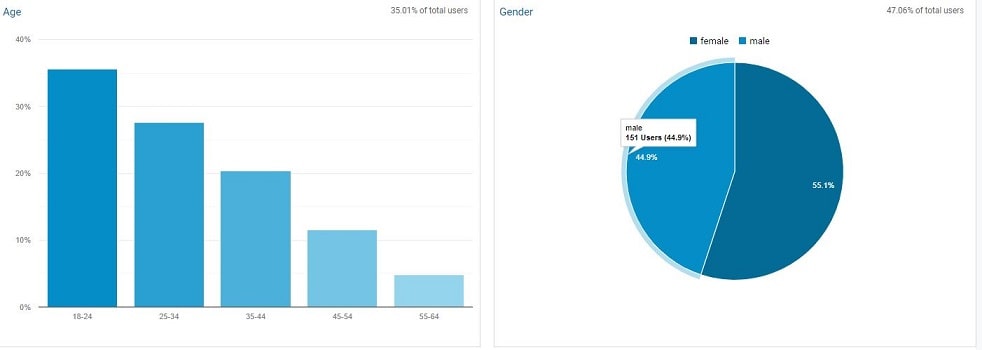
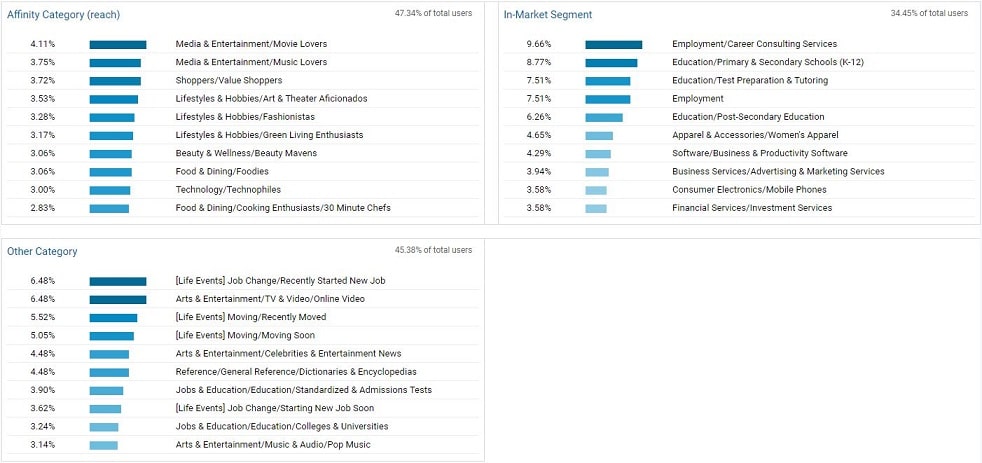
It is a metric showing the demographic profile of your website visitors (age, gender, interests, etc.). Google Analytics offers several standard demographic reports, such as:
- Demographics Overview
- Age
- Gender
- Interests Overview
- Affinity Categories
- In-Market Segments
- Other Categories
Can you name some Google Analytics reports?
- Mobile Overview Report (Audience > Mobile > Overview)
- Channels Report (Acquisition > All Traffic > Channels)
- Navigation Summary (Behavior > Site Content > All Pages > Navigation Tab)
- Landing Pages Report (Behavior > Site Content > Landing Pages)
- Site Speed Overview Report (Behavior > Site Speed > Overview)
- Goal Overview Report (Conversions > Goals > Overview)
What are the types of goals in Google Analytics?
Google Analytics offers 4 main types of goals that can help you to understand your visitors’ behavior, improve your website performance, adapt it to your visitors’ needs, and, finally, stimulate the growth of your business. The 4 Google Analytics goal types are:
- Destination – number of loads of the specific URL location.
- Duration – number of sessions that last a specific amount of time (for example 10 minutes and more).
- Pages/screens per session – number of pages seen by a user during one session.
- Events – number of triggered events (for example ad clicks).
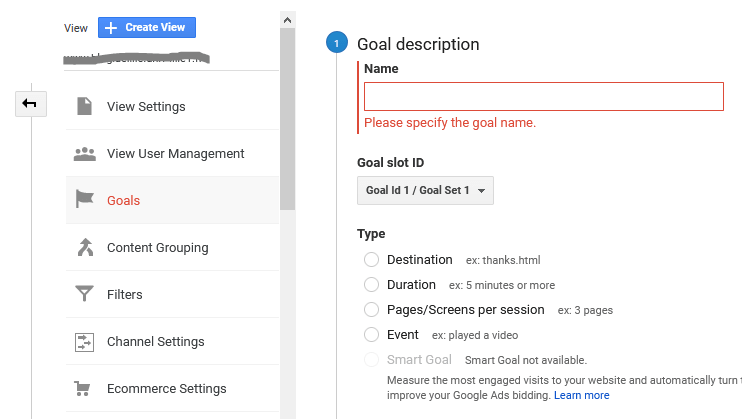
Apart from the type of goals described above, Google Analytics offers also another method to identify and track the most engaged users and based on their behavior propose the goals. These are the so-called Smart goals. They are a perfect alternative for websites that don’t have conversion or e-commerce tracking and, thus, cannot use Google Ads optimization tools like automated bidding.
What is a funnel in goals?
Funnel is one of the basic e-commerce terms. The conversion funnel (also called “purchasing funnel”, or simply “funnel”) is defined as the journey which a user/customer/consumer takes before completing a purchase.
When we talk about Google Analytics, the funnel is a series of pages that lead up to a goal. Thanks to goal funnel analysis, you will be able to determine the best order and the best content of the pages to achieve your goal. You will be also able to see the popular funnel traffic skipping steps or the pages within the funnel where most users decide to leave or change the path before completing the goal.
Google Analytics provides also special goal funnel visualization reports which are a huge help in the analysis process and for sure, will save you a lot of time.
Other Resources
| Why do you want to work at Google? Interview Question Answer |
What do you mean by conversions in Google Analytics?
Conversions are user activities that contribute to the success of your business. You can also imagine conversions as several cases when a simple, random webpage visitor got converted into a customer.
The typical conversion examples for e-commerce website would be:
- Sale/purchasing.
- Adding product(s) to a cart or a wish list.
- Newsletter sign-up.
- Social media shares.
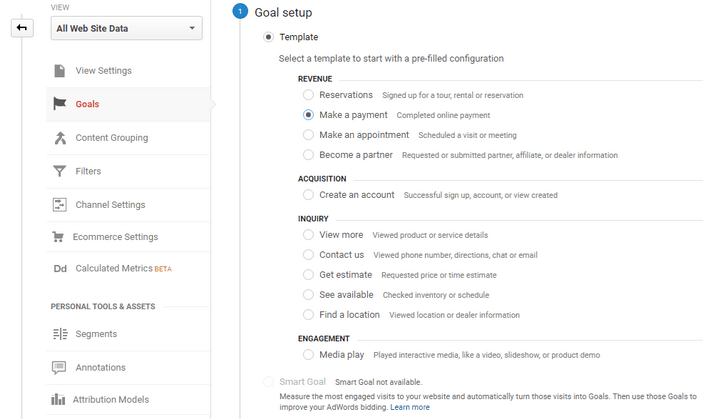
To track the above activities in Google Analytics, all that you need to do is set up the appropriate goals. Google Analytics doesn’t provide any default or pre-defined conversion goals but still, you can use some of the pre-configured goal templates.
What do you know about the bounce rate?
Bounce can be defined as a single-page session. In Google Analytics it will be a session that triggered only one server request.
The bounce rate shows the percentage of single-page sessions, so the sessions with no interaction from the user’s side. Basically, we talk about the situations, when a user opens your website and without making any other clicks, decides to leave.
What is the difference between clicks and visits?
While Google AdWords tracks the clicks, Google Analytics tracks the visits. But have you noticed that the number of clicks in Google AdWords is not always equal to the number of visits in Google Analytics? How is it possible?
Let us tell you right away that it is not because of the differences in the tools, but because clicks and visits are simply not the same.
The number of clicks represents the number of times when a user clicked on your ad. If a user clicks several times on the same ad – several clicks will be counted. The number of visits indicates the number of unique sessions opened by your visitors (session duration whether it is 2 seconds or 10 minutes, does not matter).
It can also happen that one click can generate several unique visits – it can happen, for example, if a user opens your website via an ad, and later, opens your website again but through the bookmarked URL. The number of clicks will be 1 and the number of visits – 2.
SEO interview questions and answers 2022
What data is collected by Google Analytics?
This is currently one of the hottest topics and a perfect question for the Google Analytics job interview.
As we have already mentioned above, Google Analytics does not collect any data regarding individual users. Only group statistics are available. In short, we can say, that all the collected data refers to the website performance and users’ behavior, for example:
- Session duration
- Number of pages per session
- Time spent on a page
- Traffic channels
- IP address (only for geolocation)
- Network location
- Web browser used by a user
- Operating System used by a user
What is the average load time in Google Analytics?
The average page load time is the average amount of time needed for a page to load. The average load time is calculated from the moment of page view initiation (for example: click on the link) till the time the page is fully displayed.
3 factors having the biggest impact on the average load time are:
- Network time
- Server time
- Browser time
Is it possible to separate users based on devices?
Yes, it’s possible. Google Analytics offers 2 kinds of cross-device tracking reports. The first kind of GA cross-device reports can be found under “Reporting”. The second – is under “User ID”. In the User ID view, you can choose between 3 types of cross-device reports:
- Device Overlap
- Device Paths
- Acquisition Device
What are cookies in Google Analytics?
This is another example of one of the trickiest Google Analytics interview questions but it is also something very GA specific, so definitely be ready to answer it.
In short, Google Analytics uses cookies for user identification. GA identifies every new device as a cookie and, thus, as a new visitor. What are the consequences of such a setup? For example, if a user deletes the cookies and visits your website again, he will be considered a new user. The situation becomes also a little tricky when one user uses several devices (let’s say desktop, tablet, and mobile) but luckily in such cases, GA is usually able to recognize that this is still one user (thanks to so-called persistent ID and user’s engagement data).
What is Search Depth?
Search depth is one of the metrics collected by Google Analytics Site Search reports. Search Depth represents the number of (sub) pages viewed by a user after performing a search query. It is a very useful metric providing the information about the internal search on your website and thus can help to optimize the content and the information architecture of your website.
What is Map Overlay Report?
Map Overlay Report is one of Google Analytics reports providing an automatically generated, visual representation of the geographic location of your website visitors. By default, GA will show the global geographic segmentation of your users but you have also the possibility to go deeper and generate the same report for a specific country, city, etc. It is very similar to GA location reports, but it is also much friendlier in use for local KPI analysis.
To create Map Overlay Report, log in to your Google Analytics account, click on “Customization”, Select the proper report type (“Map Overlay”), and fill in the rest of the fields.
Other Google Analytics Interview Questions:
- What is benchmarking?
- How do you report on Google Analytics?
- What are metrics?
- How to link the search console and google analytics?
- What does RPC mean in Google Analytics?
Thank you for reading the article till the end. It was the last of our list of 30 most popular Google Analytics interview questions.
Don’t forget, that if only time allows, in the end, you might be asked if you have any questions! It is a very comment practice, so don’t be surprised. Prepare in advance your own list of questions. Show your interest in the job, enthusiasm, and motivation. You can also check our article about the unique questions to ask the interviewer – you will find there over 50 examples of questions to ask and many practical tips on how to handle this part of an interview.
SMO interview questions and answers
Thank you for visiting our website! If the article was useful, leave a thumb up.
Share with others your Google Analytics interview experience by leaving a comment below!