If you would ask what interview questions, the job candidates are the most afraid of, probably they would tell you: “Excel”. MS Excel skills are currently required for almost every computer work and it is no different in the case of Data analyst interviews. So what Excel interview questions should you expect when you apply for a data analyst position? The answer comes in this article!
We have prepared for you 40+ Best Excel Interview Questions for Data Analyst with answers (2023 update). Before you start, check also our tips on how to prepare for an interview. It is a very short and easy 8-steps instruction of what you need to do before the actual interview to be the best prepared and increase your chances of getting hired!
Ready? Let’s get started!

Table of Contents
How to prepare for a data analyst interview?
If you really want to get hired, solid preparation before an interview is a must. Coming unprepared is not an option if you want to stand out from the crowd of other candidates.
Also, you will never get a chance to make a first impression, so take a moment to check the below instruction which will help you to be at your best for your interview
- Research the company which you apply for.
- Read carefully again about a job offer and a job description.
- Prepare your outfit.
- Check the route and make sure that you will not be late.
- Prepare a short presentation about yourself.
- Practice your answers on the most popular Excel interview questions for data analyst
- Prepare your own list of questions.
Check also for free our Job interview preparations full guide & checklist.
Excel Interview Questions for data analyst
What is the ribbon in Excel?
This is one of the most basic Excel interview questions.
In all Microsoft Office programs, a “Ribbon” is a toolbar (command bar). It is available at the top of a window and consists of a series of tabs, like “Insert”, “Page Layout”, “Formulas”, “Data”, etc. Each tab gathers specific program’s features, for example, the “Insert” tab is used to insert different object items, such as tables, illustrations, charts, add-ins, etc.
What is conditional formatting in Excel?
Conditional formatting is a feature that allows to automatically apply the pre-defined formatting (for example colors, data bars, etc.) to the cells based on the specified conditions.
How to clear formatting in Excel without removing the cell content?
In order to clear the formatting without removing the cell content, go to the “Home” tab, click on the “Clear” button, and select “Clear Formats”.

How to AutoFit column width in Excel?
There are 3 ways to AutoFit the column width in Excel. You can use:
- Mouse double-click. Put the mouse cursor at the right edge of the column header and double-click.
- Ribbon option. Go to the “Home” tab, click on the “Format” button and select “AutoFit Column Width”.
- Keyboard shortcut: ALT + H + O + I
What are “Freeze Panes” in Excel?
The “Freeze Panes” are used to lock the first row and/or column of an Excel worksheet, so that it (they) remain(s) always visible on the screen. The “Freeze Panes” option is available in a “View” tab of the ribbon.
How many data formats are available in Excel?
Microsoft Excel offers 11 basic data formats:
- General;
- Number;
- Currency;
- Accounting;
- Date;
- Time;
- Percentage;
- Fraction;
- Scientific;
- Text;
- Special;
What are 2 types of cell references in Excel?
There are two types of cell references in Excel: relative and absolute. The difference between them manifests itself in the way they behave when being copied from one cell to another. The relative cell references will automatically adjust while copying, while the absolute cell references will remain unchanged.
All cell references are, by default, relative. In order to switch the reference type and make it absolute, all you need to do is to add a dollar sign ($) in the cell address in the formula. In this way, you can “block” the row, the column, or both:
| Cell name | Description |
| A1 | Both column and row will adjust when copying. This is an example of relative cell references. |
| $A$1 | The column and the row will not adjust when copying. They will always remain A1. This is an example of absolute cell references. |
| $A1 | Only the column will not adjust when copying. We can call it a mixed cell reference. |
| A$1 | Only the row will not adjust when copying. We can call it a mixed cell reference. |
What is the order of operations in Excel?
This is definitely one of the most popular data analyst interview questions and you can expect it during almost every job interview touching Excel competencies.
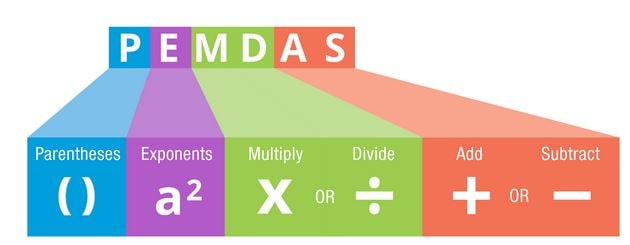
In Excel, same as in mathematics, the order of operations is strictly defined: Parentheses, Exponents, Multiplication, and Division (from left to right), Addition, and Subtraction (from left to right). It is a so-called PEMDAS rule.

What is the difference between COUNT, COUNTA, COUNTBLANK, and COUNTIF?
COUNT is a function that counts the cells containing numbers or values. COUNTA is a function that counts the cells containing any type of values (excluding blank cells). COUNTBLANK is a function that counts the blank cells. COUNTIF is a function that counts the cells meeting specific criteria.
To learn more about value counting in Excel, go to support.microsoft.com.
What is VLOOKUP and how do you use it?
This is also one of the most common Excel interview questions.
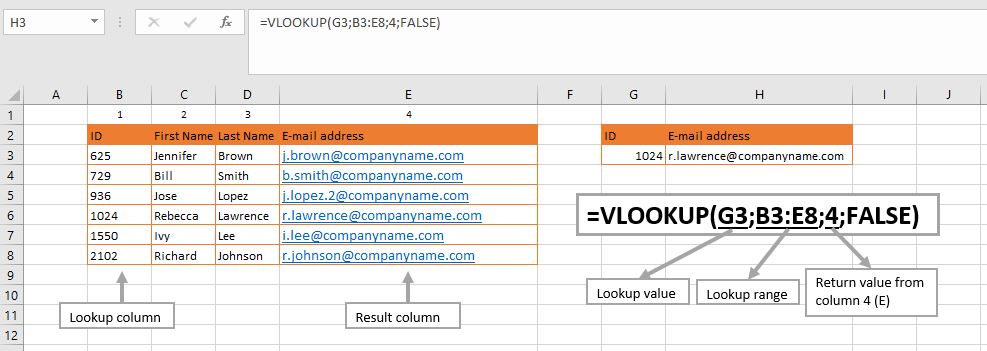
VLOOKUP stands for “Vertical Lookup”. It is one of the most helpful Excel functions! Thanks to VLOOKUP, we can automatically search for a certain value in a column, in order to get a value from another column in the same row. Check the example below:

What are VLOOKUP limitations?
- VLOOKUP cannot look left. The value which we look for must be in the very left table column and the values to return, on the right-hand side.
- VLOOKUP cannot lookup two columns.
- VLOOKUP finds only the first match.
- Default Setting for VLOOKUP is a so-called “Approximate Match”.
- Inserting a column will revert an error.
What are the comments in Excel?
Microsoft Excel gives a possibility to add comments to the cells. If a cell has a comment, a red triangle symbol is visible in the top right corner of the cell. In order to see the comment, place the cursor on the comment symbol. In order to add a comment, right-click on a cell, select “New Comment” and click on “Enter”. Alternatively, you can also use a shortcut Shift + F2.
What is the chart in Excel?
Charts are the graphic presentation of the data. And when it comes to the charts, Excel offers a whole variety of choices. You can choose from 10+ different chart types, depending on what the chart will be used for and what kind of data will be presented. Each chart type contains also the sub-types and, in consequence, the possibilities in this area are almost unlimited.
What are the different types of charts available in Excel?
As we have already mentioned in the question above, depending on the Microsoft Office version which you use, you can choose from 10 up to even 19 different chart types, such as:
- Column;
- Line;
- Pie;
- Doughnut;
- Bar;
- Area;
- X Y (Scatter);
- Bubble;
- Stock;
- Surface;
- Radar;
- Treemap;
- Sunburst;
- Histogram;
- Box & Whisker;
- Waterfall;
- Funnel;
- Combo;
What is a pivot table in Excel?
Pivot tables are one of the most popular data analysis tools. While a “normal” table is used to organize the data, pivot tables can be used for data summary and analysis, and, in consequence, quickly provide the answers to even the most complicated business questions, like trends, etc.
There are two ways to insert a pivot table:
- Ribbon option. Go to the “Insert” tab, click on the “PivotChart” button, select “PivotChart”, check the options and click on “OK”.
- Keyboard shortcut: Alt + D + P
How to refresh a pivot table?
By default, Excel pivot tables are not refreshed automatically. In order to refresh pivot table data:
- Click anywhere in the pivot table and activate “PivotTable Tools” on the Ribbon.
- Click on the “Analyze” section, click on the “Refresh” button and select “Refresh”
In order to update the pivot tables in the whole workbook, instead of “Refresh”, click on “Refresh All”.
Alternatively, you can also use the keyboard shortcut: Alt + F5.
What is the dashboard in Excel?
If you are preparing for a data analyst interview, the question about the Excel dashboards is definitely the one to expect.
The dashboards are used to provide a simplified, one-window overview of the large volumes of data. The more data we have, the more accurate and helpful dashboard is. The dashboards are often used, for example, in the KPI tracking or status follow-ups, regardless of the area that we are working in: whether it is finance, IT, business, etc. They usually contain several elements, such as tables, numbers, or charts.
What is macro in Excel?
A macro can be defined as a programmable rule or pattern allowing the automation/imitation of some repetitive, routine tasks, such as keystrokes, mouse clicks, commands, etc.
What are the two macro languages in Excel?
Currently, the most popular macro language in Excel is VBA (Visual Basic for Applications) but the previous versions of Excel were using XLM.
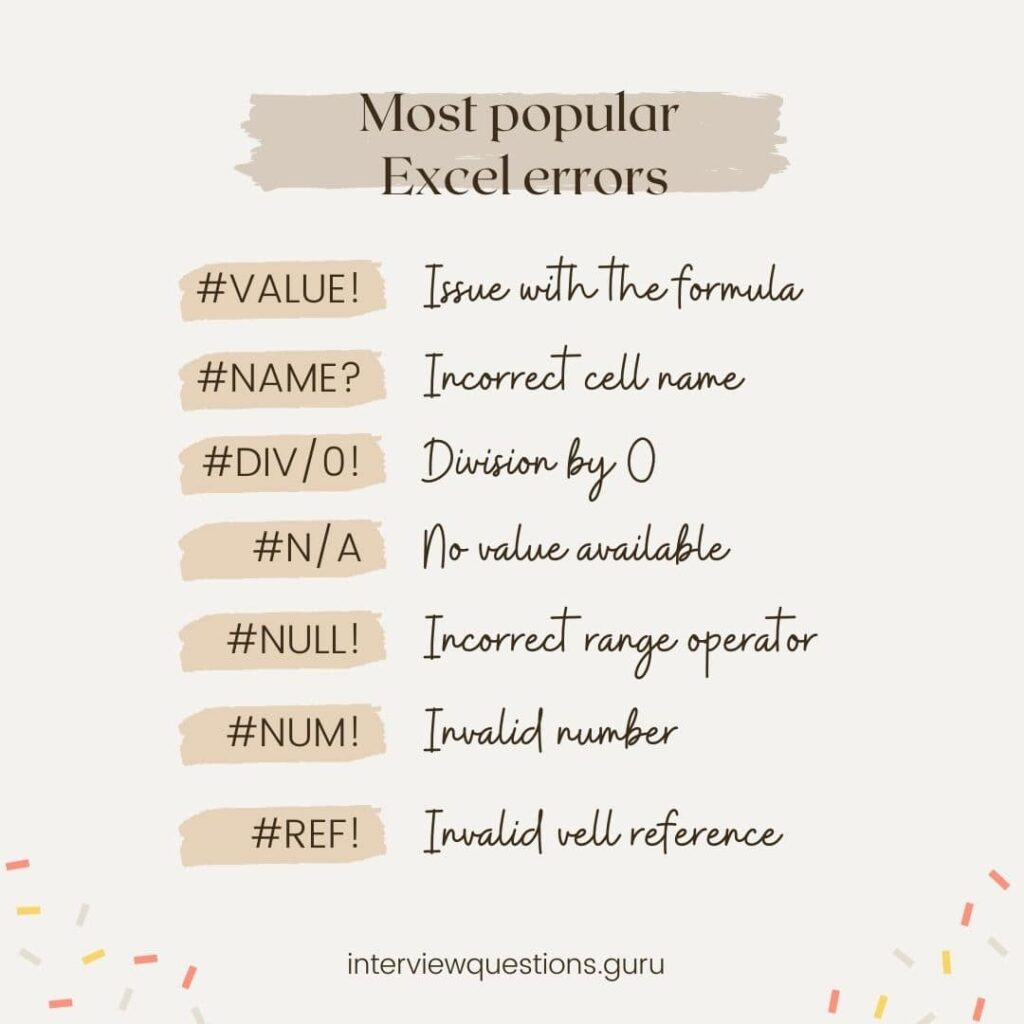
What are the most popular error messages in Excel?
| Error | Description |
| #VALUE! | The issue with the formula or cells referencing |
| #NAME? | Incorrect cell name |
| #DIV/0! | Division by zero |
| #N/A | No value available |
| #NULL! | Incorrect range operator |
| #NUM! | Invalid number |
| #REF! | Invalid cell reference |

Other Data Analyst Interview Questions
Tell me about your work experience.
What are your greatest strengths?
What are your greatest weaknesses?
What is data analysis in simple words?
What are the 3 steps of data analysis?
What is data mining?
What is data profiling?
What is data cleaning?
What are the 3 types of data validation?
What does KNN Imputer do?
What is an outlier in data analysis?
What data analysis tools do you know?
In your opinion, what are the key skills for data analysts?
In your opinion, what are the biggest challenges in data analytics?
How would you handle missing or suspected data?
How would you estimate the population of daisies in a field?
Why do you want to become a data analyst?
Why should we hire you?
Where do you see yourself in 5 years?
What is your expected salary?
Do you have any questions for us?

It was the last of our 40+ Best Excel Interview Questions for data analysts.
To be even better prepared, check our other Excel articles:
Top 75 Excel Interview Questions
80+ Must Know Excel shortcuts for Windows
80+ Must Know Excel shortcuts for Mac
Thank you for visiting the interviewquestions.guru.
Help us to grow as writers by giving a thumb up and leaving a comment below.
Thanks!